6.6 DOE Test Area North, INEEL, Idaho
The Test Area North (TAN) site covers 890 square miles in the northern portion of the Idaho National Laboratory (INL), which is about 50 miles northwest of Idaho Falls, Idaho. This facility is operated by the U.S. Department of Energy (DOE) and was historically used for nuclear energy knowledge and applications such as the experimental breeder reactors, EBR-I and EBR-II. TAN was developed by the Atomic Energy Commission and the U.S. Air Force to develop nuclear-powered aircraft in support of the Aircraft Nuclear Propulsion program. From 1950 to 1972, all liquid waste streams generated at TAN were introduced directly into the basalt aquifer (Snake River Plain Aquifer), approximately 200-300 feet below ground surface, through injection wells. Waste streams included low-level radioactive wastewater, industrial wastewater (including organic liquids), and sanitary sewage. Historical records provide little information on the types and volumes of organic wastes injected into the groundwater; estimates of total TCE injection range from 350 to 35,000 gallons. The direct result of these injection activities was a two-mile trichloroethene (TCE, C2HCl3) plume at concentrations >20,000 µg/L.
6.6.1 Technical Basis for Remedial Action
The vadose zone of the Snake River Plain Aquifer consists of fractured basalt lava flows with rhyolite and unconsolidated sediments. The aquifer beneath this plain covers approximately 10,800 square miles and is composed of layered basalt lava flows and sediment. Water from this aquifer is important for agricultural purposes and spring flows.
The CSM for TAN was developed through an iterative process of identifying data gaps, conducting activities to fill those data gaps, reporting on the results of those activities, and identifying new data gaps. Examples of characterization activities that were conducted in the source area after the sludge removal activity was completed included:
- wells installation within or adjacent to the source area
- pumping tests, slug tests, and tracer tests
- standard geophysical, gamma spectroscopy, and acoustic logging
- cross-well seismic tomography
- groundwater sampling
These activities greatly improved the understanding of aquifer hydraulic conductivity, porosity, and preferential flow paths; dissolved contaminant composition and distribution; and residual contaminant source distribution.
6.6.2 Decisions
The original ROD (DOE-ID 1995) for the TAN groundwater contamination selected P&T as the default remedy. Additionally, five innovative technologies were evaluated for their potential to enhance or replace P&T. These technologies included: metal-enhanced reductive dechlorination, monolithic confinement, in situ chemical oxidation, enhanced in situ bioremediation (ISB), and MNA. A ROD amendment signed in September 2001 (DOE-ID 2001) documents regulatory approval of enhanced ISB as the final remedy for the plume hot spot and MNA as the final remedy for the distal portion of the plume.
6.6.3 Assessment
A nine-month full-scale field evaluation of ISB was performed at TAN beginning in January 1999. The overall objective of the enhanced ISB field evaluation, focused in the high-concentration source area of the plume (>20,000 µg/L TCE), was to determine whether the intrinsic biodegradation of TCE could be enhanced through addition of an electron donor. Sodium lactate was injected from 1999 to 2004, followed by single-well injections of whey in 2004, alternating and multiple well injections from 2006 to 2007. In 2008, Lactate was added back-coupled with whey to reduce the pH of the system, and in 2012 ISB was transitioned into a rebound test.
The Air Stripper Treatment Unit (ASTU) was operated from November 1998 through December 2000 to provide containment during the ISB field demonstration. The ASTU was placed on standby shortly before the NPTF became operational. At the time, the ASTU was expected to remain on standby. However, concentrations of TCE remained elevated near the ASTU. Because operation of the ASTU had been shown to reduce TCE concentrations in its vicinity, the ASTU was restarted in January 2011 as a component of the P&T remedy for the medial zone. When the reinjection well TAN-49 started backing up in July 2011, the ASTU was shut down and once again placed on standby. A timeline of the TAN remediation technologies is shown in Figure 32.
Full-time operation of the NPTF occurred for 3.5 years from 2001 to 2005, and decreased TCE concentrations to approximately 100 µg/L. The Rebound Test Plan for OU 1-07B (ICP 2004) from March 1, 2005, to March 5, 2007, assessed the overall impact of NPTF operations on remediation of the medial zone. Based on results obtained during the rebound test, the long-term operational strategy of NPTF was modified to a pulsed-pumping strategy. The objective of pulse-pumping operations was to maintain TCE concentrations in the medial zone below 200 μg/L through a cycle of operation and standby modes. From November 16, 2007, to December 7, 2009, NPTF was operated in standby mode. Since December 7, 2009, NPTF has been operated voluntarily approximately 4 days a week, except when shut down for maintenance.
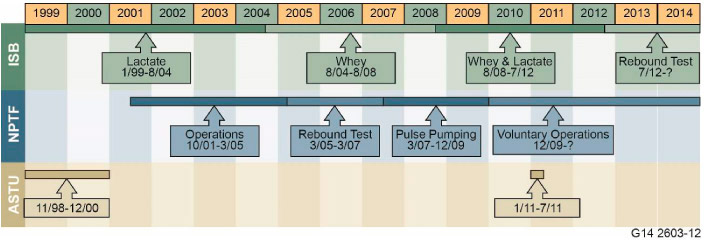
Figure 32. Test Area North groundwater remediation timeline (1999–2014) (DOE-ID 2016).
MNA was evaluated in 1999-2001, and the results showed that TCE attenuation was occurring through multiple lines of evidence, including use of the tracer corrected method, biological assessments, and overall concentration trend analysis. A lines of evidence approach was used to provide quantitative biological attenuation of the contaminants in groundwater, including the use of quantitative polymerase chain reaction, and enzyme activity probes coupled with lab microcosm studies. These data supported the ROD amendment for MNA. The restoration time frame for MNA is to achieve MCLs by 2095.
6.6.4 Monitoring/Optimization
The ISB rebound test must continue to assess the residual source in the aquifer because reducing conditions are needed to maintain enhanced dissolution of the contaminant in the basalt matrix. The rebound test may continue for up to five years. The vadose zone investigation indicated that the vadose zone is not the source of TCE impacting TAN-28 (sentinel groundwater monitoring well which has not decreased in concentration over the duration of evaluation), and is probably a minor contributor to aquifer TCE contamination. Additional vadose zone investigation is not required at this time. The TAN-28 TCE source assessment indicated that an untreated portion of the aquifer is responsible for the elevated TCE concentrations in TAN-28.
Compliance monitoring results indicate that NPTF operated within established limits throughout 2014. Routine inspections were performed, as required. TCE concentrations were less than 75 μg/L in monitoring wells TAN-33, TAN-36, and TAN-44, and NPTF influent concentrations were at the low end of the historical range. Concentrations of VOCs in NPTC effluent samples all met the water effluent-discharge criteria for the last five years. Sr-90 results for the effluent were below detection limits and MCLs in all samples since last year.
More time is needed to determine whether natural degradation rates will meet MCLs by 2095 for all areas of the plume. The TCE plume has expanded in the direction of TAN-57 from 2009 to 2015 (Figure 33); however, this expansion is within that predicted by the conceptual model developed in 1999-2005. TCE was not detected in TAN-56 in 2015. The TCE concentration in TAN-57 was less than the 10-μg/L criteria for drilling an additional down-gradient well. Plume expansion was less than the 30% allowed in the ROD Amendment.
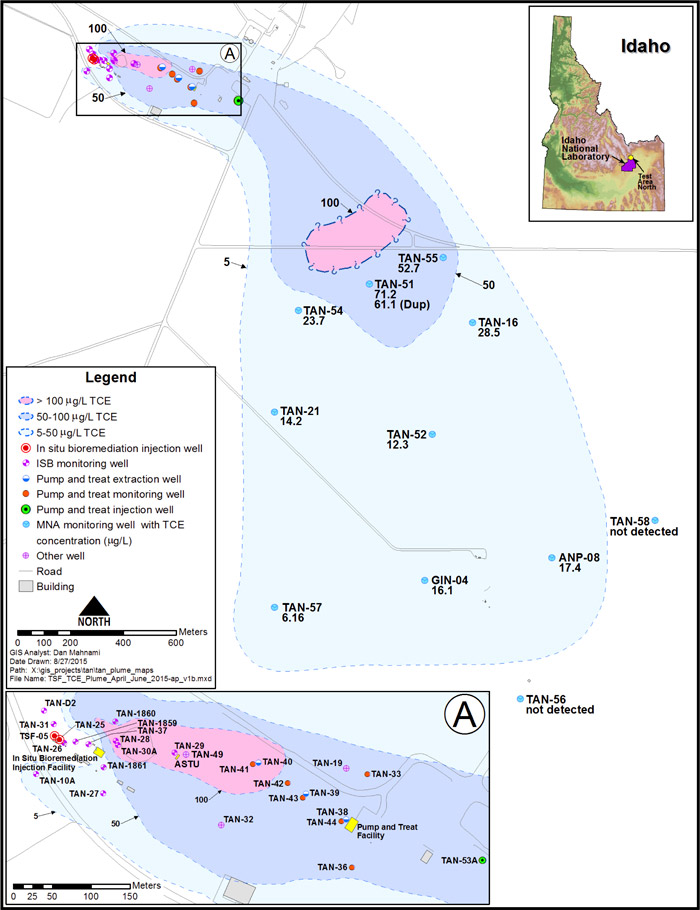
Figure 33. TCE distribution in the aquifer at the TAN site in 2015 (DOE-ID 2016).
6.6.5 Summary of Alternatives
Alternatives include a holistic systems-based approach, consisting of the following:
- Interagency project team consisting of USEPA, DOE, IDEQ, and public was formed.
- The scientifically defensible strategy for the site was reevaluated when new technologies or approaches were applicable and available (mass flux, revise CSM, molecular tools).
- Strategies were optimized throughout the plume to save money and increase performance. For example, the PNT rebound study and shut down resulted in an estimated cost savings of $8 million over PNT for the lifetime of plume.
- The monitoring program was modified (reduced on year to year basis) based on defensible data (concentration, risk).
6.6.6 Regulatory and Stakeholder Involvement
The state of Idaho (ID-DEQ), DOE-ID, and USEPA regulators have worked together with the technical project teams and the stakeholder organizations since the beginning of the evaluations at the TAN site. The integration of innovative research and remedial operations, as agreed upon by the agencies, has been a novel approach to the CERCLA process and has proved particularly successful at the TAN site.

